The most complete and precise statistics
Measure and control the results in real time
Request a demoTake intelligent decisions before starting
Which is the best hour to send the SMS campaigns? When there is better clicks rate in the mailings? Which is the best day to have an optimal answer rate in your voice sendings?
Analyze accurately all the interactions of your target, get valuable reports to optimizing your campaigns and increase your sales. Create new campaigns in just a click based on the results.
Start your sendings with 360NRS analysing the global data of the 360NRS community and taking the best decisions.
We are the first Multichannel Marketing platform sharing all the results by country, anonimously, so that your first campaign is a complete success.

100% real Compromise
Try our platform without commitment and perform tests without costs
Be free! Hire our service with no commitment.
The most desired Multichannel statistics
It comprehends all the channels used in a single campaign and analyze with detail the results.
Compare, measure and create new sendings from the data provided or new contact groups based on the results.
Download your best reports in pdf, csv or share your results through a link.
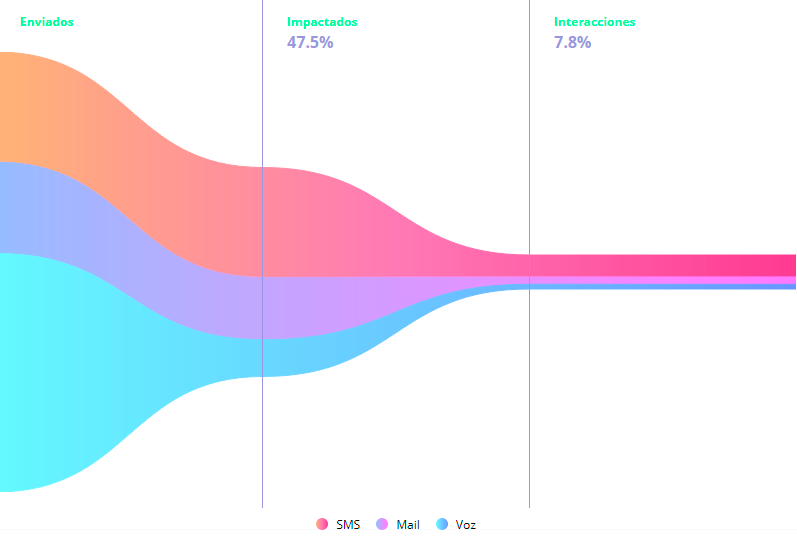
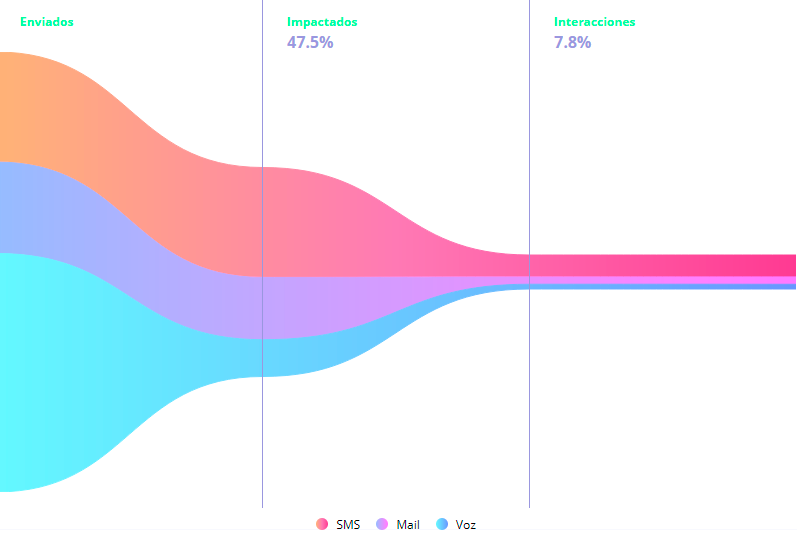
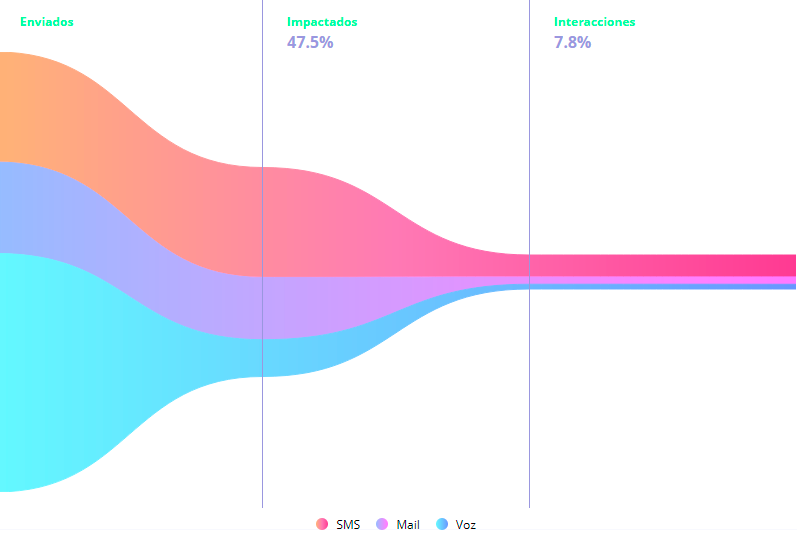
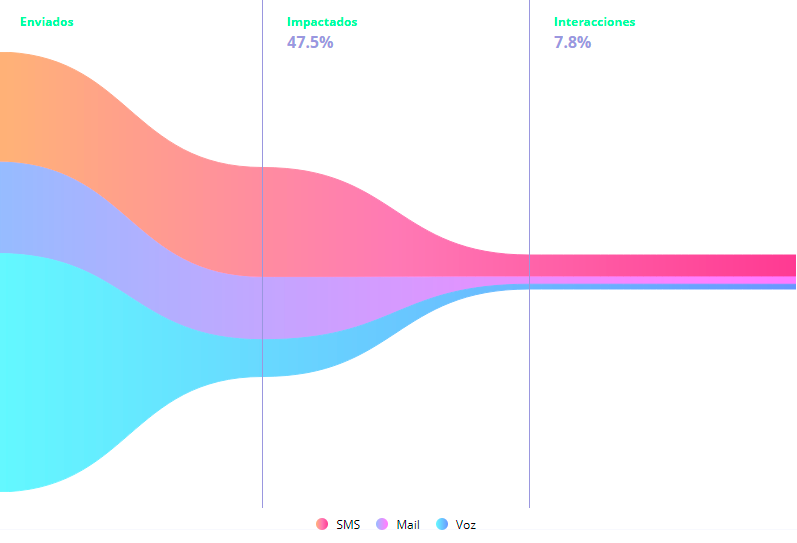
Conversion funnel of your campaign
Analyze in detail the stages that your client pass through.
Our platform will classify and organize your campaign depending on the user being on sent, impacted or interacted status. In this way, you will be able to detect possible mistakes and optimize the conversion rate.
Campaigns per devices
Discover and analyze the conversion data or impact per technological devices.
Through this consumption habit indicator, you will be able to direct your next campaigns depending on the device that generated with more openings, clicks or conversions.
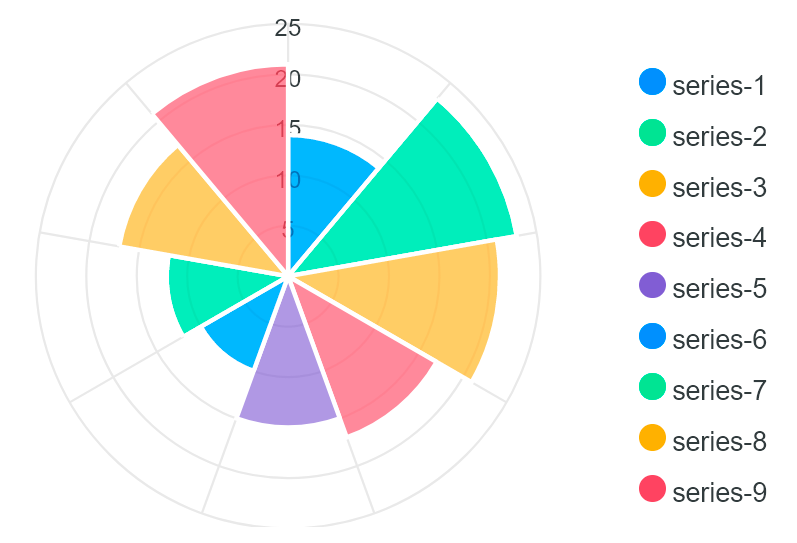
Costs per sending and channel
Study the cost of your campaign per sending.
360NRS provides you with the total cost of your campaign divided between the targeted contacts of your campaign and the sending of an specific channel.
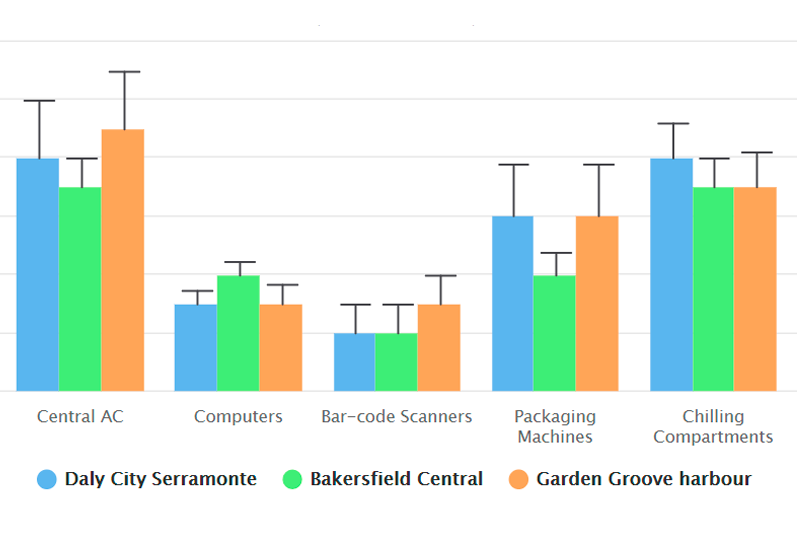
Clicks and cost per impact or interaction
Take decisions depending on the cost of getting a first action with your campaign or sending.
The impacted users will be the ones who have opened your campaign, meanwhile the users with interaction will be those that have made click on the URL of the SMS, on a button of the mailing or on a key in the interactive call.
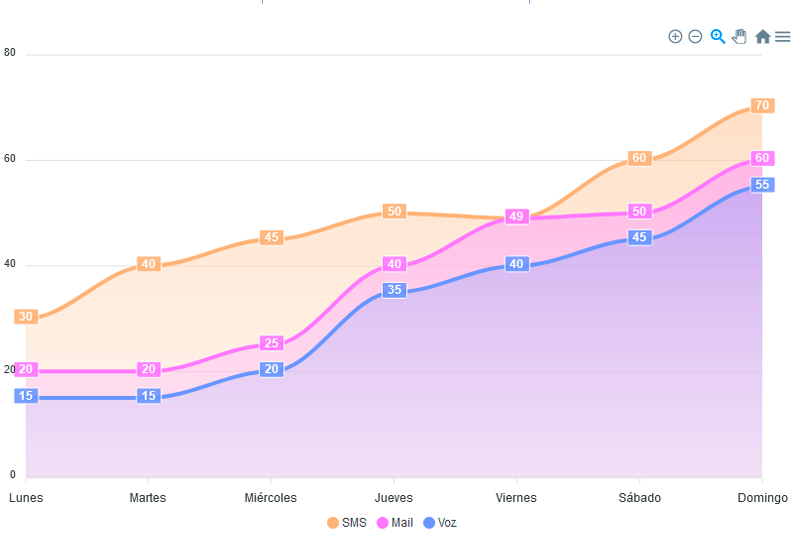
Users impacted or not impacted
Create new groups depending if the client has opened your campaign or not.
Optimize your database and results depending on the not impacted.
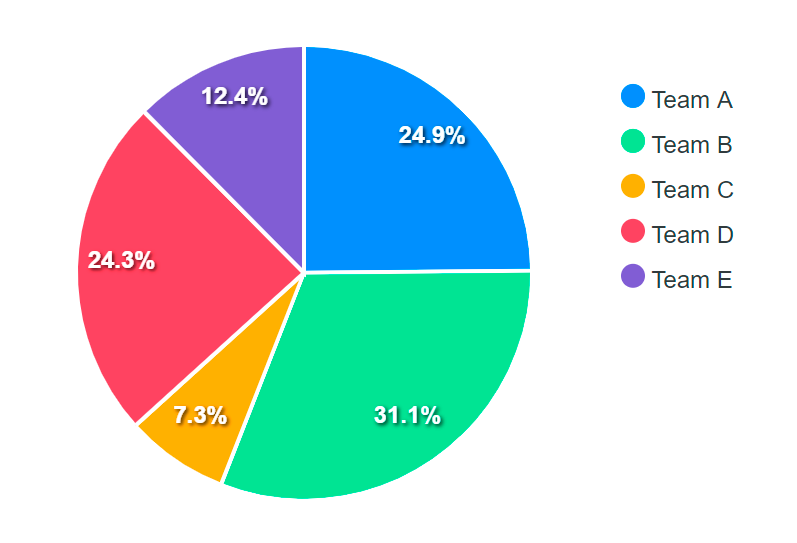
Users not communicated in X days
Improve your relational marketing strategy taking into account the days that pass since the last communication sent.
This metric will help you to create and keep a proximity relationship with your client.
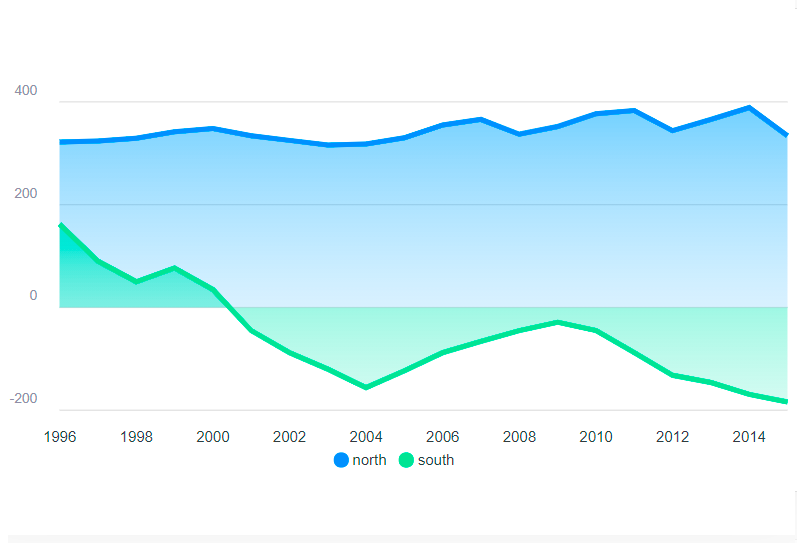
Total of contacts in Black List
Investigate about the contacts that have unsuscribed from your communications and find out the reason of the action.
Capture them again with all the informationg compiled with each one of our metrics.
Statistics per sending
360NRS provides comparative statistics for each channel, to see in a look all your campaigns in a range of time.
Preview
We show you a preview of your sending and its content: texts, sender, links and landing page.
In order that you can know which content has worked better to you for the next sendings.
Heat map
Identify the key zones
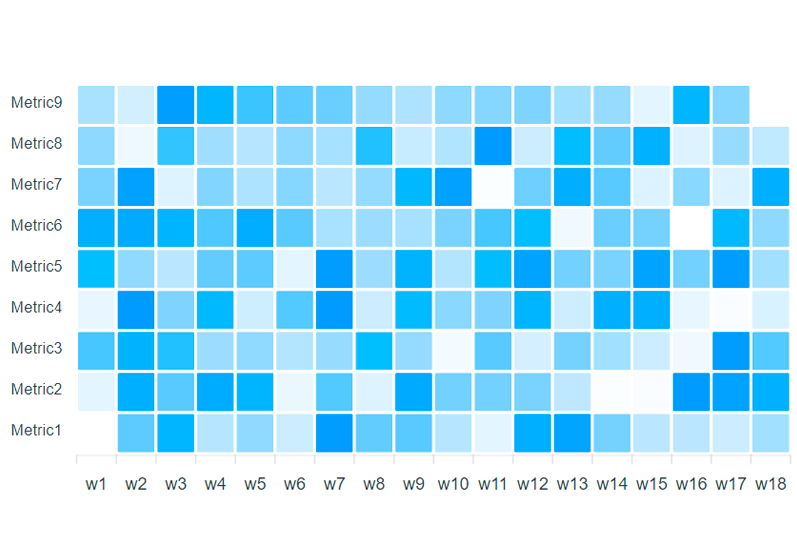
Our heatmap graphic allows you to identify the areas that calls more the attention of your mailing or landing page, with the purpose of analysing and improve the usability, engagement and capacity of the conversion of your content.
Analyze the detail
Discover in a glance how has your sending worked through our Summary
We offer you the possibility of exporting new statistics per sending in csv, pdf or ling with graphics for a professional report, in which are highlighter the real time results of:
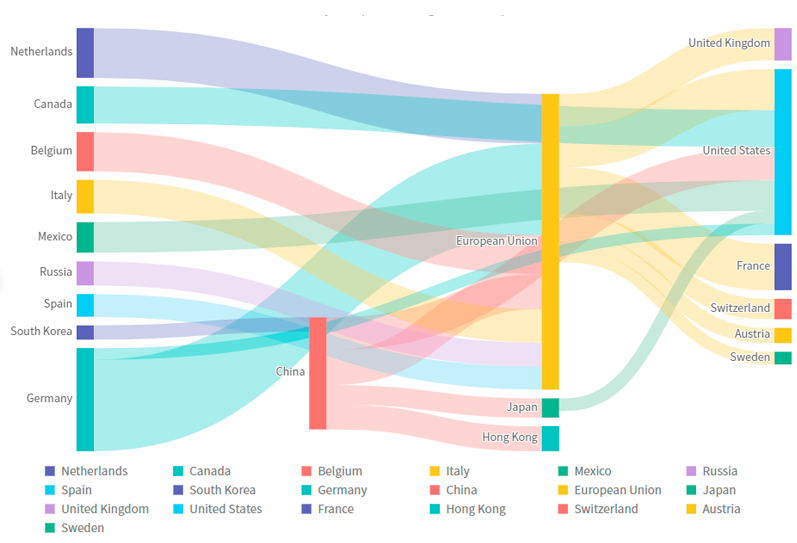
Conversion rate of your sending
It is the amount of users performing an action.
The conversion rate of your sending will depend on your goal: it can be a purchase, a telephone call or the visit to the Landing Page itself.
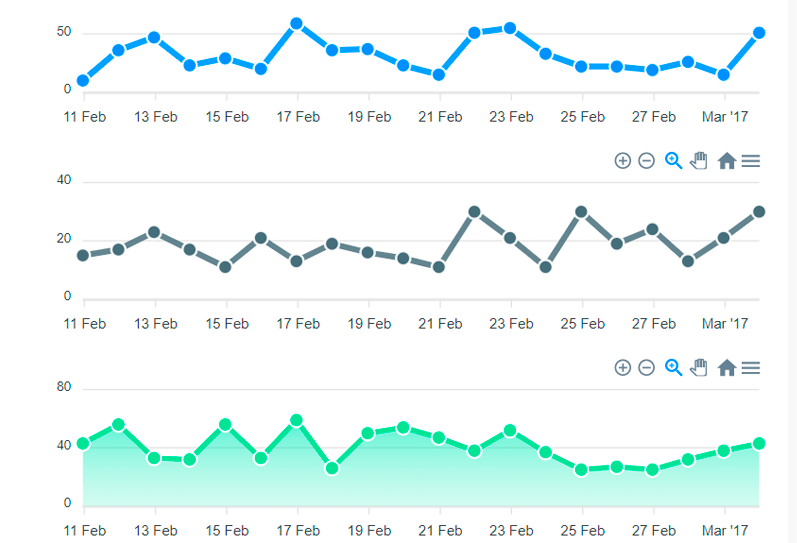
Open Rate
Represent the percentage of opened messages over the total of messages sent.
As higher is the Open Rate of your sending, there are more possibilities that the users interact with a link or landing page.
Click To Open Rate (CTRO)
Examine the percentage of users of your sending that finally made a click on one of the links of the message sent.
In this graphic are only taken into account the users that opened the communication (Open Rate) divided into those that finally showed interes in the button or URL.
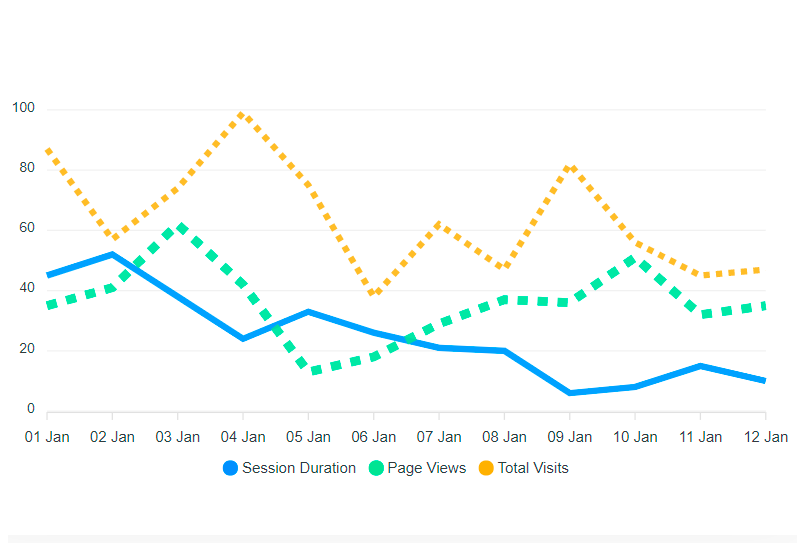
Click Through Rate (CTR)
Discover which is the CTR of your sending.
It is based in one of the most important indicators of your campaign, as it gives you a visual percentage of the total of users that made click oover the total of users that have seen your message.
 Try it free without obligation. APIs and integrations available.

